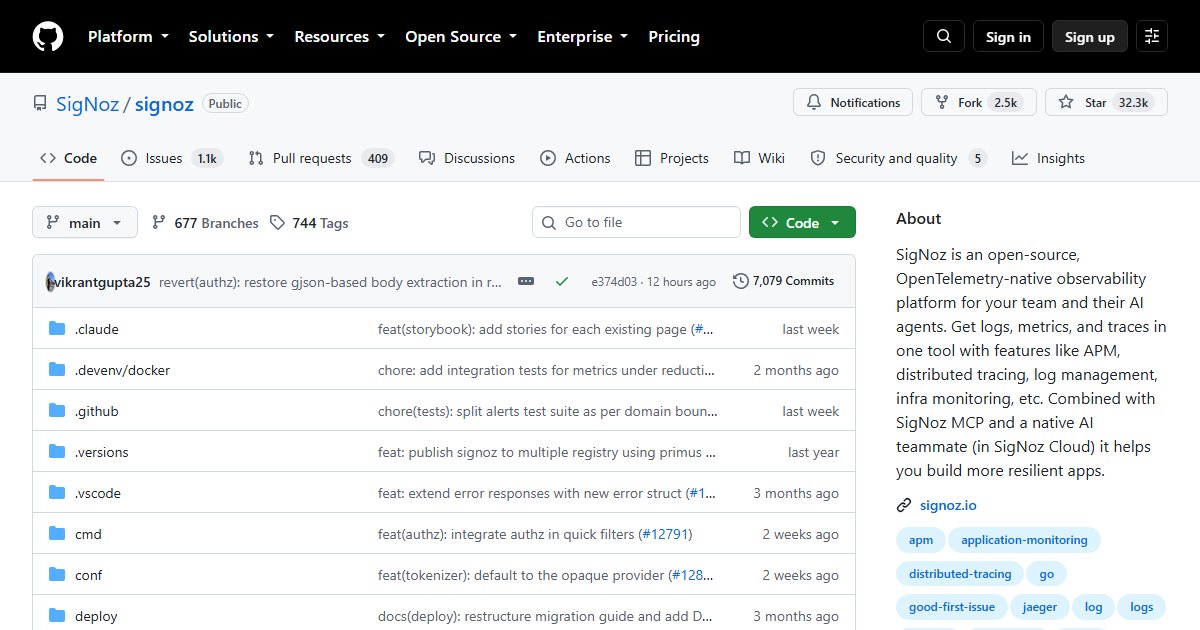
SigNoz: OpenTelemetry-Native Observability for Traces, Metrics, and Logs
SigNoz is an observability platform that brings application traces, metrics, and logs together in one place. It is built natively on OpenTelemetry, the vendor-neutral standard for instrumenting applications, and stores data in ClickHouse, a fast columnar database. It positions itself as a self-hostable alternative to Datadog and New Relic.
Features
- APM: latency, error rate, throughput, and Apdex per service, plus database and external call breakdowns
- Distributed tracing with flame graphs and waterfall views, following a request across services
- Logs with a visual query builder, linked to the traces that produced them
- Metrics and custom dashboards
- Alerts on any signal
- Infrastructure monitoring for hosts and Kubernetes
- LLM observability: tracing AI apps, token usage, latency, and cost
The value is correlation: jump from a slow endpoint to the trace, from the trace to its logs, and from logs to the host metrics at that moment.
Deployment
The Community edition is self-hosted with Docker Compose, Kubernetes, or Linux installers. SigNoz also offers a managed cloud and an enterprise edition with additional features under a separate license.
You instrument applications with OpenTelemetry SDKs or the OpenTelemetry Collector, which means your instrumentation is not tied to SigNoz; you can switch backends later.
ClickHouse wants resources: plan for several gigabytes of RAM and fast disks, and set retention periods so storage does not grow without limit.
When it fits
SigNoz suits teams running their own applications, especially microservices, who want traces as well as metrics. For monitoring servers and homelab services, lighter tools fit better: Prometheus and Grafana, Netdata, or Beszel. For logs alone, Loki and OpenObserve are simpler.