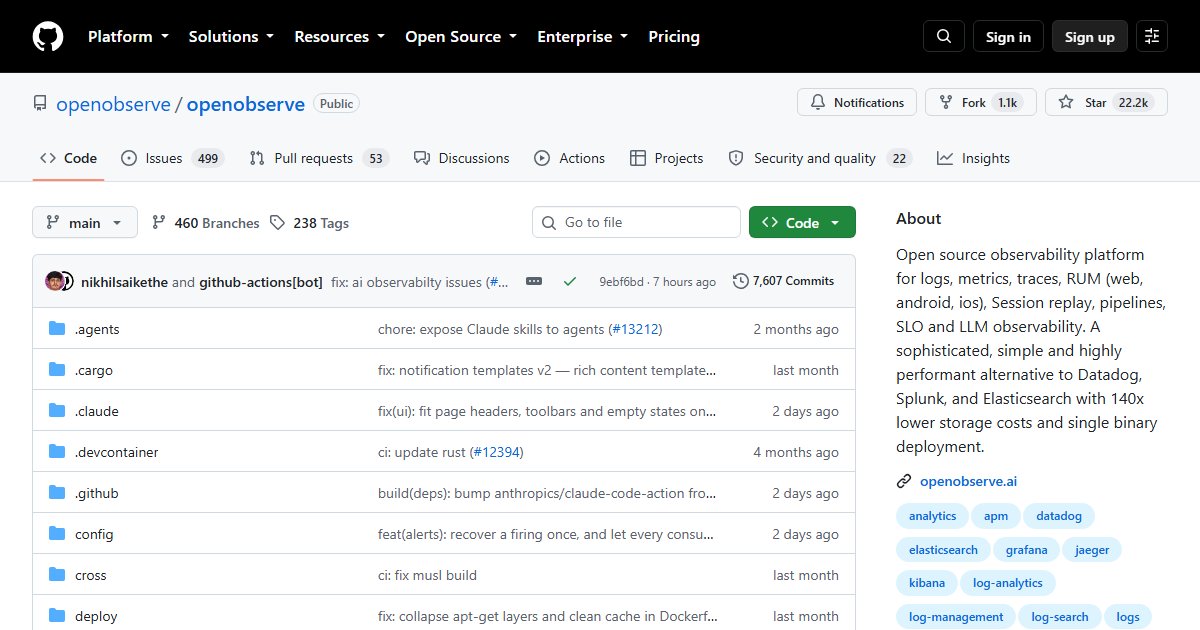
OpenObserve: Logs, Metrics, and Traces in a Single Binary With Cheap Storage
OpenObserve collects logs, metrics, traces, and real user monitoring data, and stores it far more cheaply than traditional log platforms. It ships as a single binary that can be running in minutes, and it can keep data in S3-compatible object storage.
Why the storage matters
Elasticsearch-based log stacks index everything and keep it on fast disks, which gets expensive quickly. OpenObserve stores data in columnar Parquet files with heavy compression, on local disk or object storage such as RustFS, Garage, or MinIO. The project claims dramatically lower storage costs (up to 140x) compared with Elasticsearch; real results depend on your data, but the difference is substantial.
Features
- Logs, metrics, traces, and RUM with session replay
- SQL queries for logs and traces, PromQL for metrics
- Dashboards, alerts, and pipelines to transform data on ingest
- Compatible ingestion APIs, including Elasticsearch-compatible endpoints, OpenTelemetry, and Prometheus remote write, so existing shippers like Fluent Bit and Vector work
- LLM observability
Deployment
Run the single binary or container for a small setup; switch to a high-availability cluster with object storage for larger ones. The open source edition is AGPL-3.0; an Enterprise Edition adds SSO, advanced RBAC, and audit trails.
When it fits
| Need | Good fit |
|---|---|
| Centralised logs for a homelab or small team | OpenObserve, Loki |
| Full APM with traces for your apps | SigNoz, OpenObserve |
| Server metrics and alerting | Prometheus + Grafana |
| Security logs and SIEM | Wazuh, Graylog |
Our Loki centralised logging guide covers the main alternative approach.
License
GNU Affero General Public License v3.0 (open source edition).