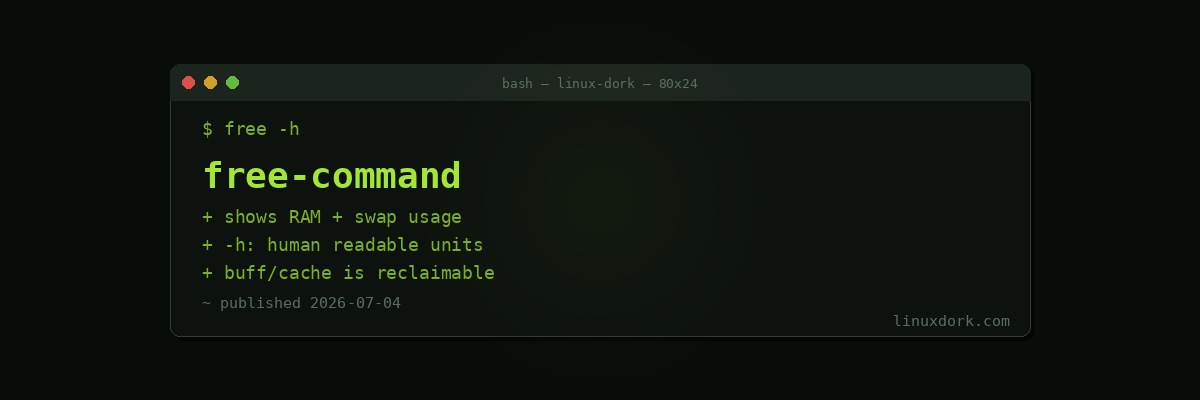
The free Command Explained
Checking memory usage on Linux usually starts with free, a small utility that reads /proc/meminfo and formats it into a table. It looks simple, but the columns are frequently misread, particularly the difference between “free” and “available”, which trips up even experienced administrators diagnosing a system that looks fine but reports almost no free RAM.
Basic Usage
free -hTypical output:
               total        used        free      shared  buff/cache   available
Mem:            15Gi       4.2Gi       2.1Gi       412Mi       8.9Gi        10Gi
Swap:          2.0Gi          0B       2.0Gi
The -h flag prints sizes in human-readable units (Gi, Mi) instead of raw kilobytes. Without it, every number is in KiB by default, which is harder to scan quickly.
Reading Each Column
total
Total installed physical RAM (or configured swap, on the Swap line), minus a small amount the kernel reserves for itself at boot.
used
Memory currently allocated to processes and the kernel, calculated as total - free - buff/cache (roughly; the exact formula varies slightly by kernel version). This number alone is not a reliable indicator of memory pressure because it does not distinguish memory actively needed by applications from cache that could be freed instantly.
free
Memory doing absolutely nothing: not allocated to any process, not used for cache, not used for buffers. On a system that has been running for more than a few minutes, this number is often small, because Linux fills spare RAM with disk cache rather than leaving it idle. A small free value is not a problem by itself.
shared
Memory used by tmpfs filesystems and shared memory segments (like those used by System V IPC or POSIX shared memory). Usually small unless something specific is using tmpfs heavily.
buff/cache
The combined size of kernel buffers and the page cache. Buffers hold block I/O metadata; cache holds file content read from or written to disk. Both shrink automatically the instant an application requests memory that isn’t otherwise available. This is why a system showing “only 2GB free” out of 16GB can still have 10GB “available.”
available
An estimate, calculated by the kernel, of how much memory could be handed to a new application right now without triggering swap. It accounts for reclaimable cache and buffers. This is the number to watch, not free. If available is consistently low relative to total, the system is genuinely under memory pressure.
Swap: What to Watch For
The second line of free output shows swap usage. Some swap usage is normal and even healthy: the kernel may proactively swap out memory pages that haven’t been touched in a while to keep more RAM available for active use and cache. This is controlled by the vm.swappiness sysctl setting.
What indicates a real problem is swap usage that is large and actively growing, particularly alongside low available memory and a system that feels sluggish. That combination means the kernel is under enough pressure to be moving active pages to disk, which is orders of magnitude slower than RAM.
# check current swappiness (0-100, higher = more eager to swap)
cat /proc/sys/vm/swappiness

# watch swap activity live
vmstat 1
Continuous Monitoring
free -s 2 -hThis refreshes the display every 2 seconds. For longer monitoring sessions or a more visual layout, watch -n 1 free -h or an interactive tool like htop (which shows a memory bar graph alongside per-process usage) is usually more convenient.
Common Options
| Flag | Meaning |
|---|---|
-h | Human-readable units (Ki, Mi, Gi) |
-m | Force megabytes |
-g | Force gigabytes |
-s N | Repeat every N seconds |
-c N | Repeat N times, then stop |
-t | Add a total line combining Mem and Swap |
-w | Wide mode, splits buffers and cache into separate columns |
Frequently Asked Questions
What does the free command show?
free displays a summary of physical RAM and swap usage: total memory installed, how much is used, how much is free, how much is used for buffers and cache, and how much is actually available for new applications. It reads this data from /proc/meminfo and presents it in a compact table, refreshed only when you run the command (unless you use the -s flag for repeated sampling).
Why does free show low free memory even when the system feels fine?
Linux uses spare RAM to cache disk data and buffer filesystem metadata, since unused RAM provides no benefit sitting idle. This cached memory shows up as used in the raw free column but is instantly reclaimable the moment an application needs it. The available column already accounts for this and is the number to actually watch, not free.
What is the difference between free and available memory?
free is memory not being used for anything at all, including cache. available is an estimate of how much memory could be given to a new application right now without swapping, which includes reclaimable cache and buffers. available is almost always much larger than free and is the more useful number for judging whether a system is actually low on memory.
What does buff/cache mean in free output?
buff/cache combines two things: buffers (short-lived caches for block device I/O and filesystem metadata) and cache (the page cache, which holds recently read or written file data in RAM so subsequent access is faster). Both are reclaimed automatically under memory pressure, which is why high buff/cache numbers are normal and not a sign of a problem.
When should I worry about swap usage shown by free?
A small amount of swap used is often normal since the kernel may swap out rarely-used pages to keep more RAM available for cache. The concerning pattern is swap usage that is large and actively changing, especially combined with low available memory and sluggish performance, which suggests the system is actively swapping pages in and out under real memory pressure.
How do I get a continuously updating view with free?
Run free -s N to refresh the output every N seconds, for example free -s 2 for a refresh every two seconds. Add -h at the same time for human-readable units. For a more visual continuously updating view, tools like watch -n 1 free -h or htop are often more convenient for extended monitoring sessions.